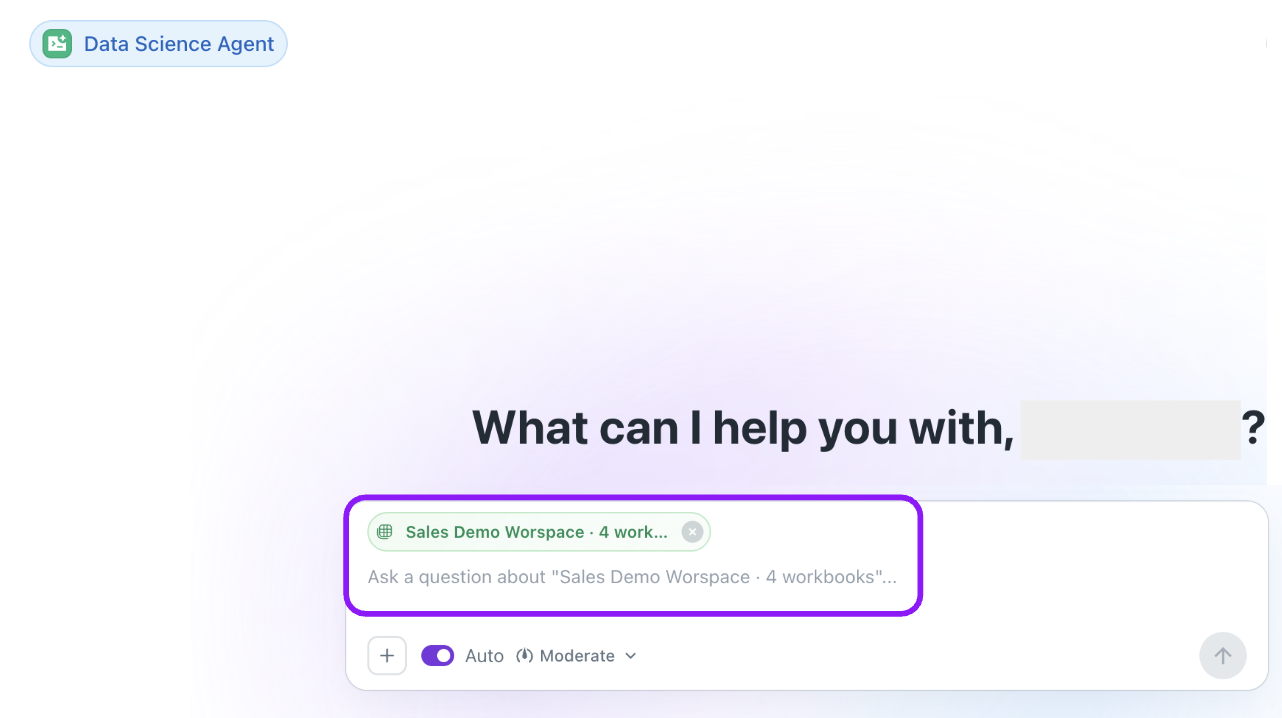
Data Science agent
What is Data Science agent?
The Data Science agent is an AI-driven analytical tool that executes Python code to analyze data from your workbooks and generate diverse outputs, including tables, Python code, charts, and detailed explanations. This agent is particularly useful for in-depth data analysis, visualization, and transformation.
The Data Science agent not only fetches data but also writes and executes Python code in real-time to perform sophisticated modeling like RFM, segmentation, cohort tracking, and churn analysis.
It writes, explains, and executes Python code in real-time, providing a transparent and interactive environment for data exploration.
-
Technical accessibility: Non-technical users can interact via natural language, while technical users can copy the generated Python code for local use.
-
Interactive planning: The agent proposes a plan and code; users must provide a compulsory feedback (e.g., Continue or Add a pie chart) before execution.
-
Visual exports: Charts can be downloaded in PNG format (via the camera icon), and processed data can be downloaded as a CSV or Zip file.
-
Iterative refinement: You can ask follow-up questions to modify charts or add deeper filtration layers in real-time.
Exploring Data Science agent
Let's explore the Data Science agent with the following use cases:
The Data Science agent excels at turning high-level business questions into technical data models. Here is how to execute specific analytical frameworks.
RFM analysis using Data Science agent
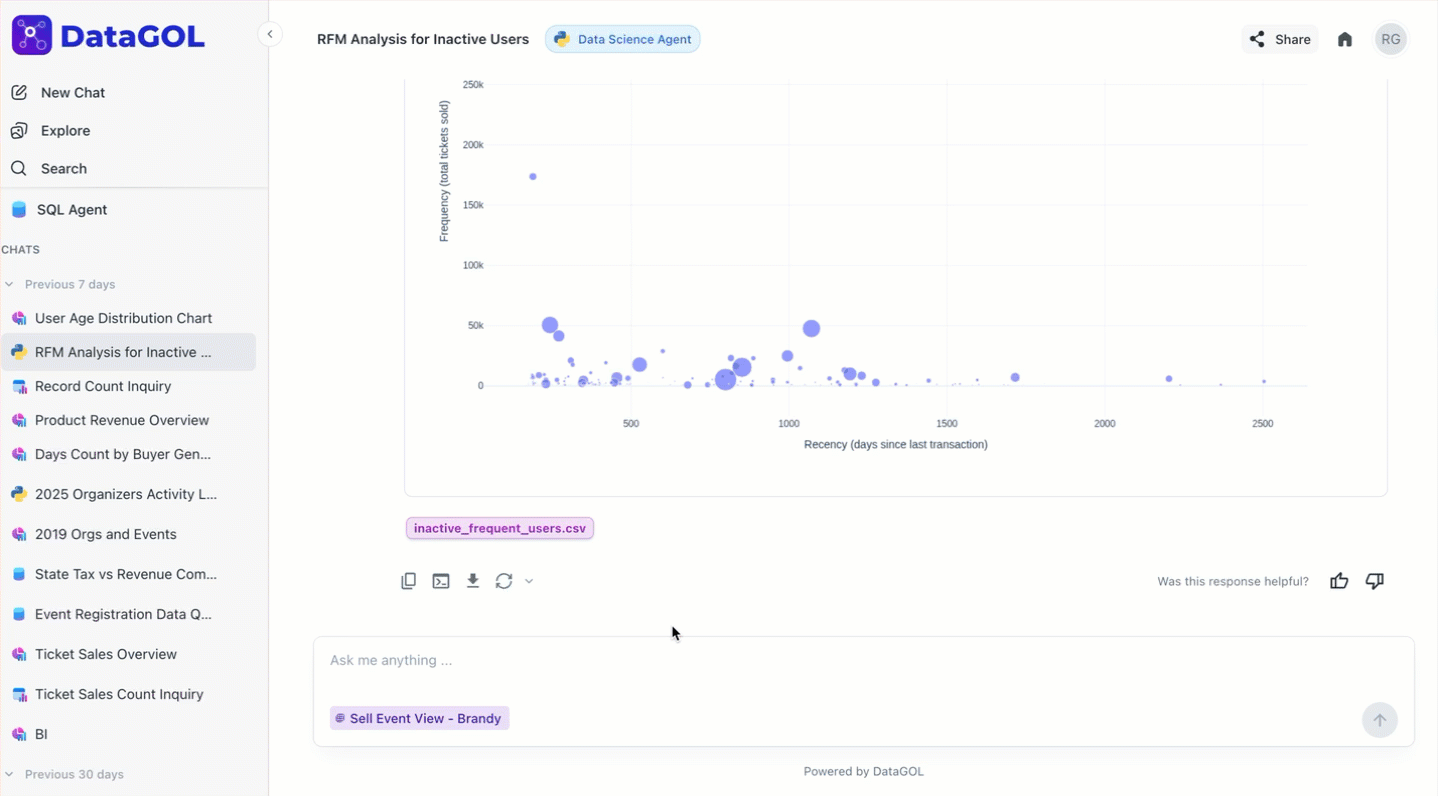
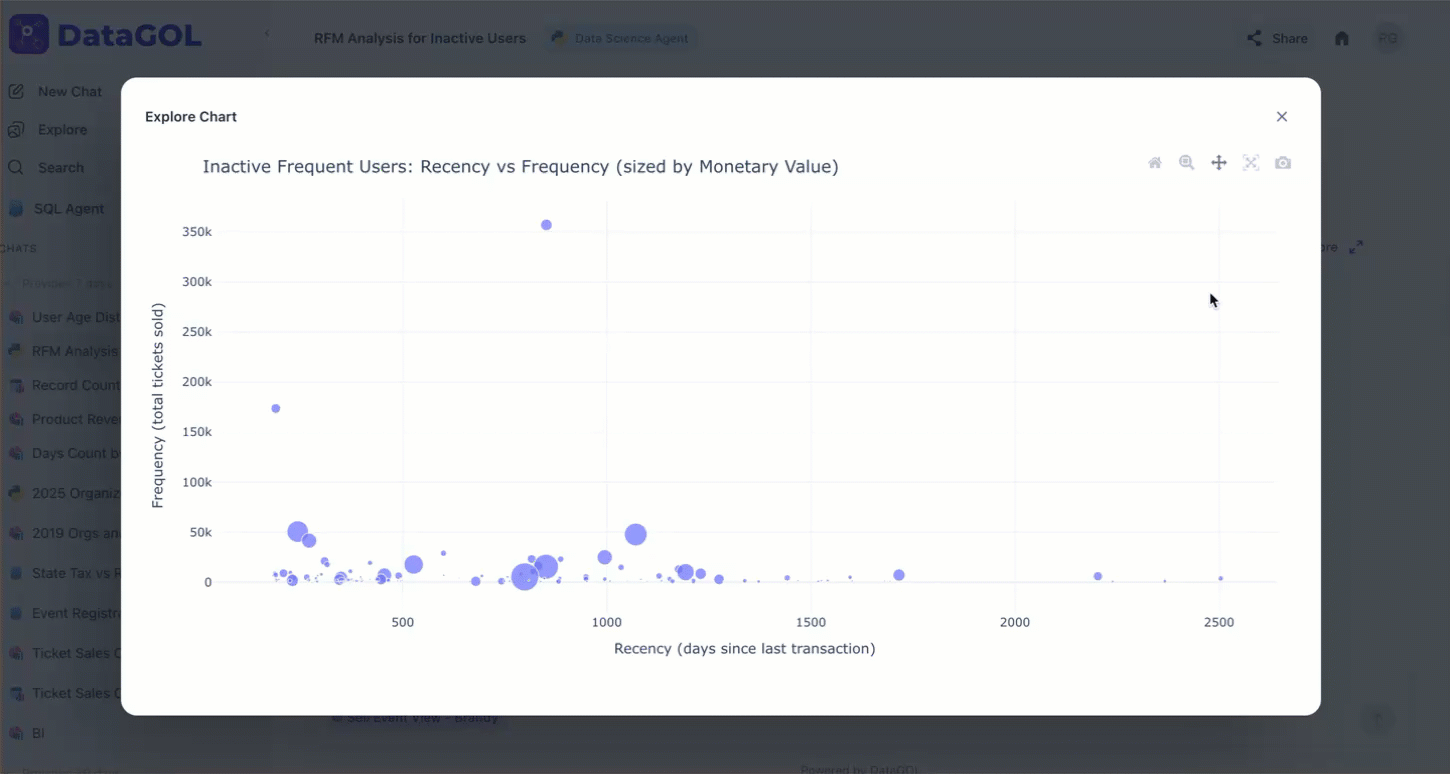
RFM stands for Recency (days since last purchase), Frequency (total transactions), and Monetary (total spend). The Data Science agent can calculate these scores from raw event logs or sales data.
Identify high-value customers who have become inactive to spark re-engagement. The agent calculates scores for Recency (days since last purchase),Frequency (total transactions), and Monetary (total spend).
To perform RFM analysis using Data Science agent, do the following:
-
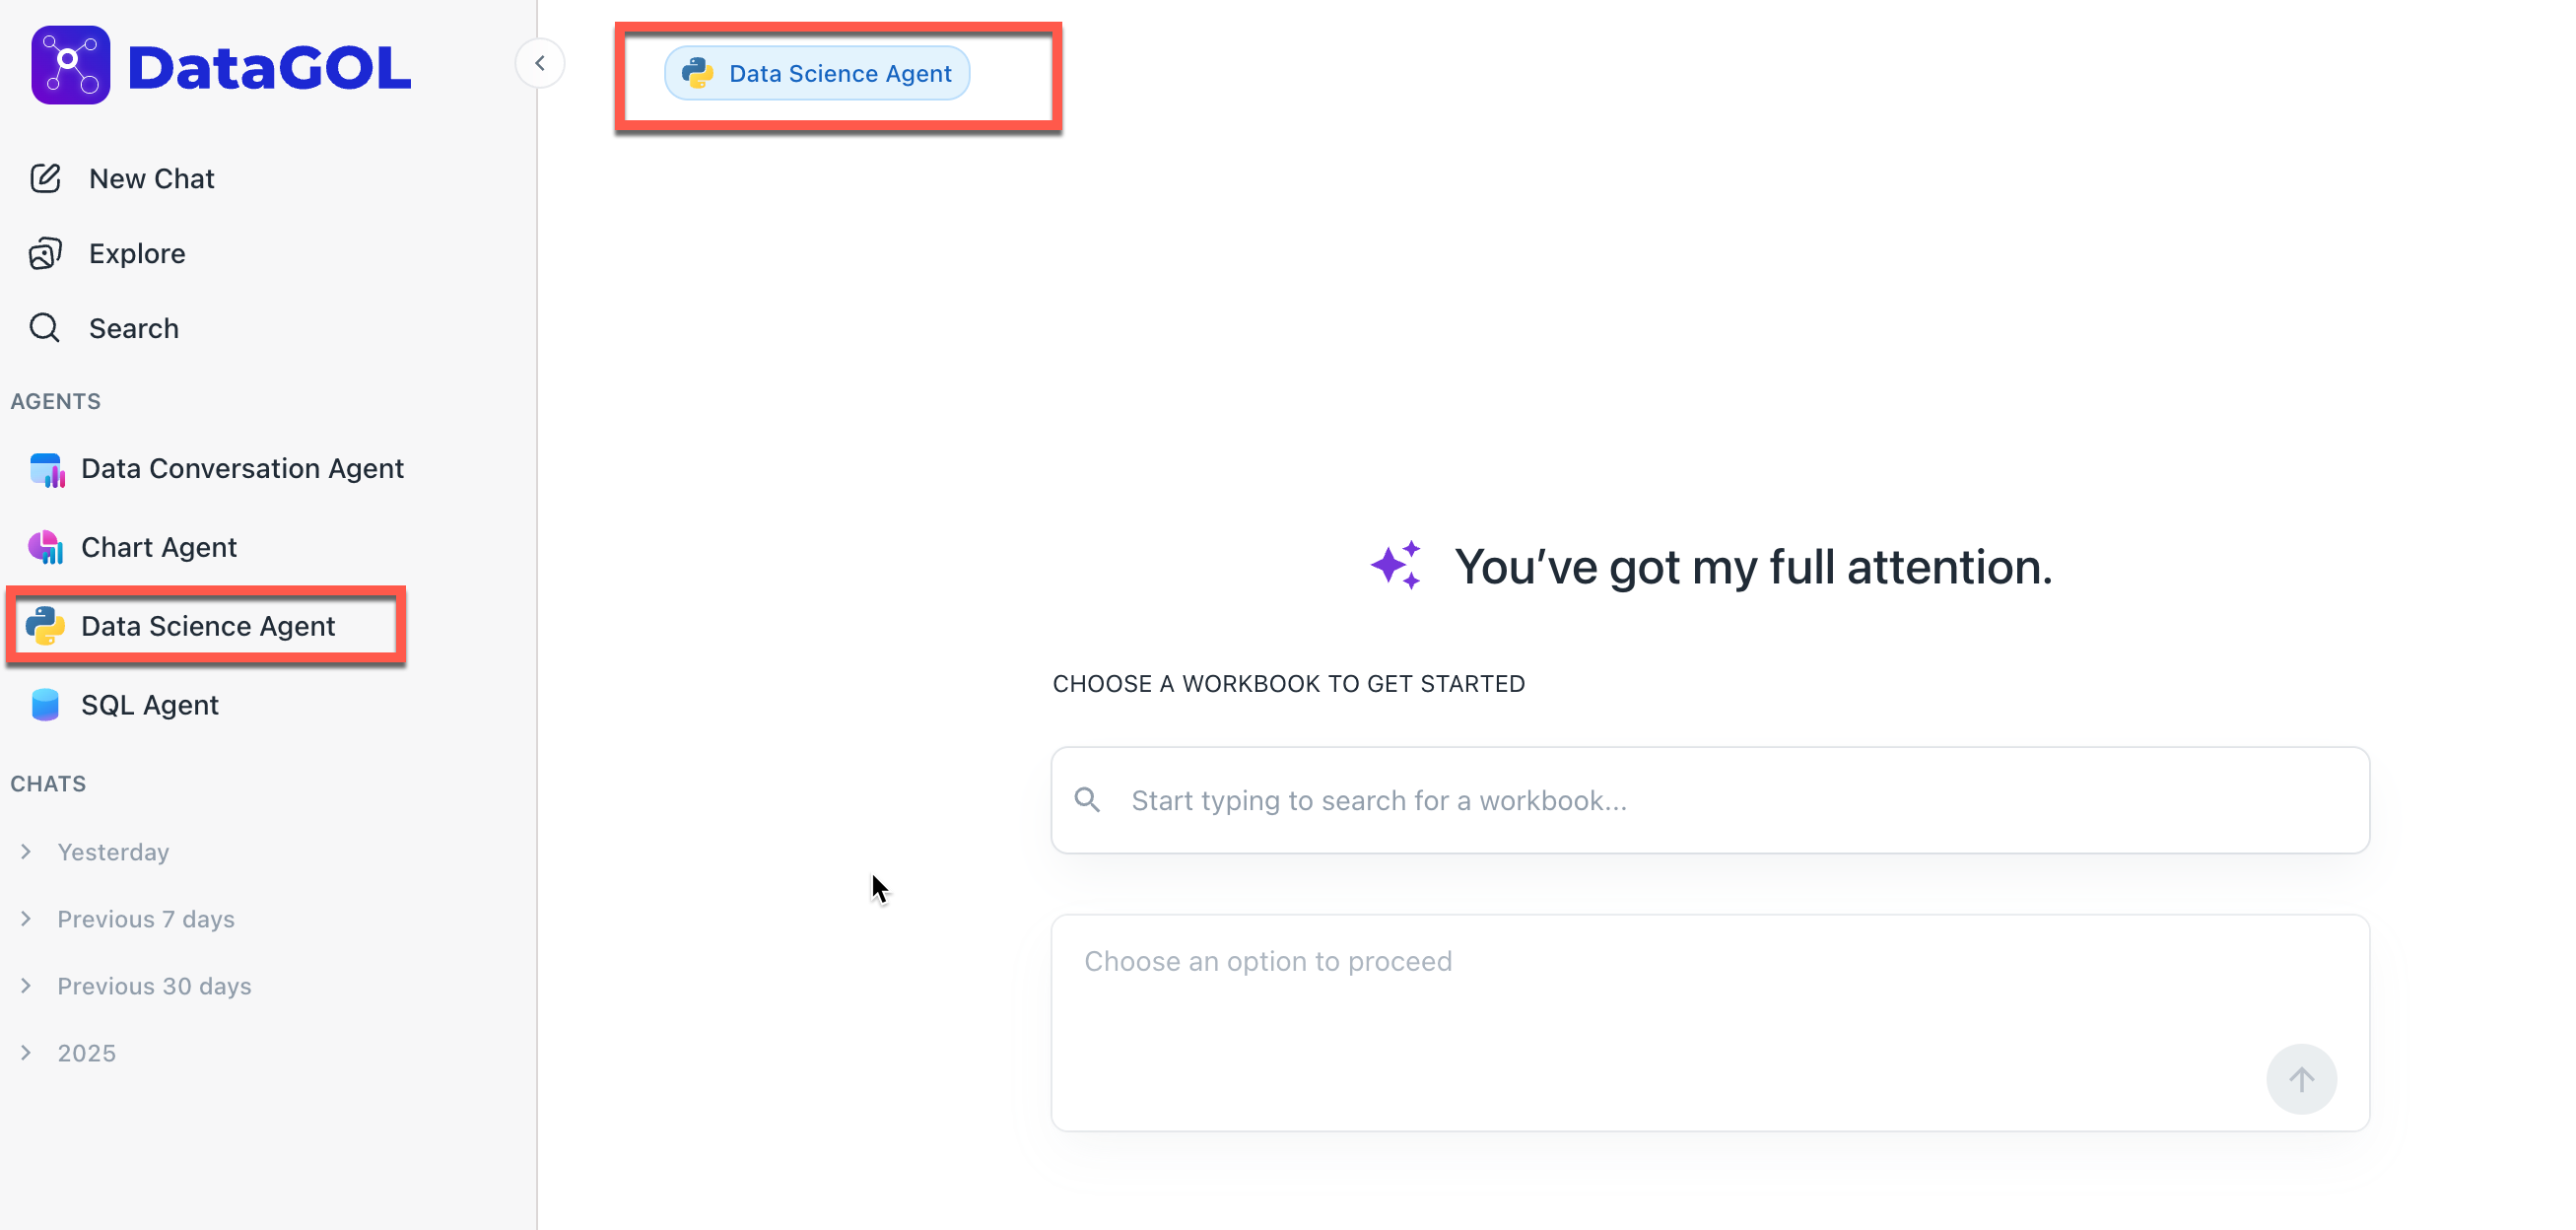
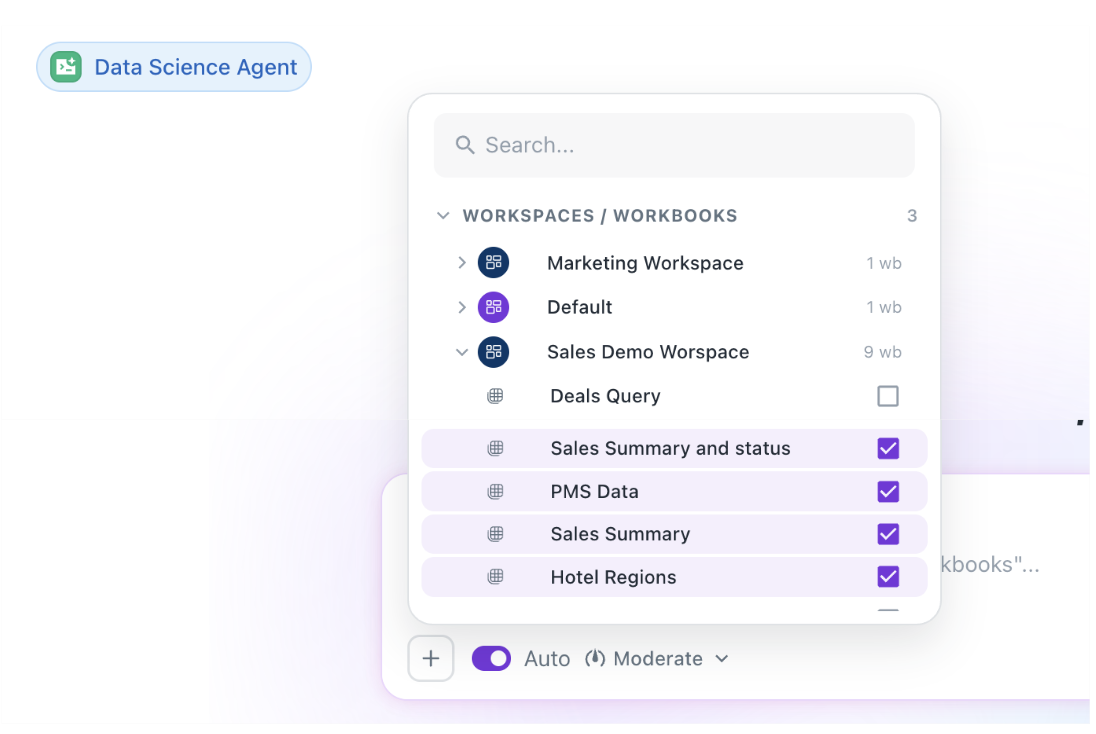
Navigate to the Agents section and select Data Science Agent
-
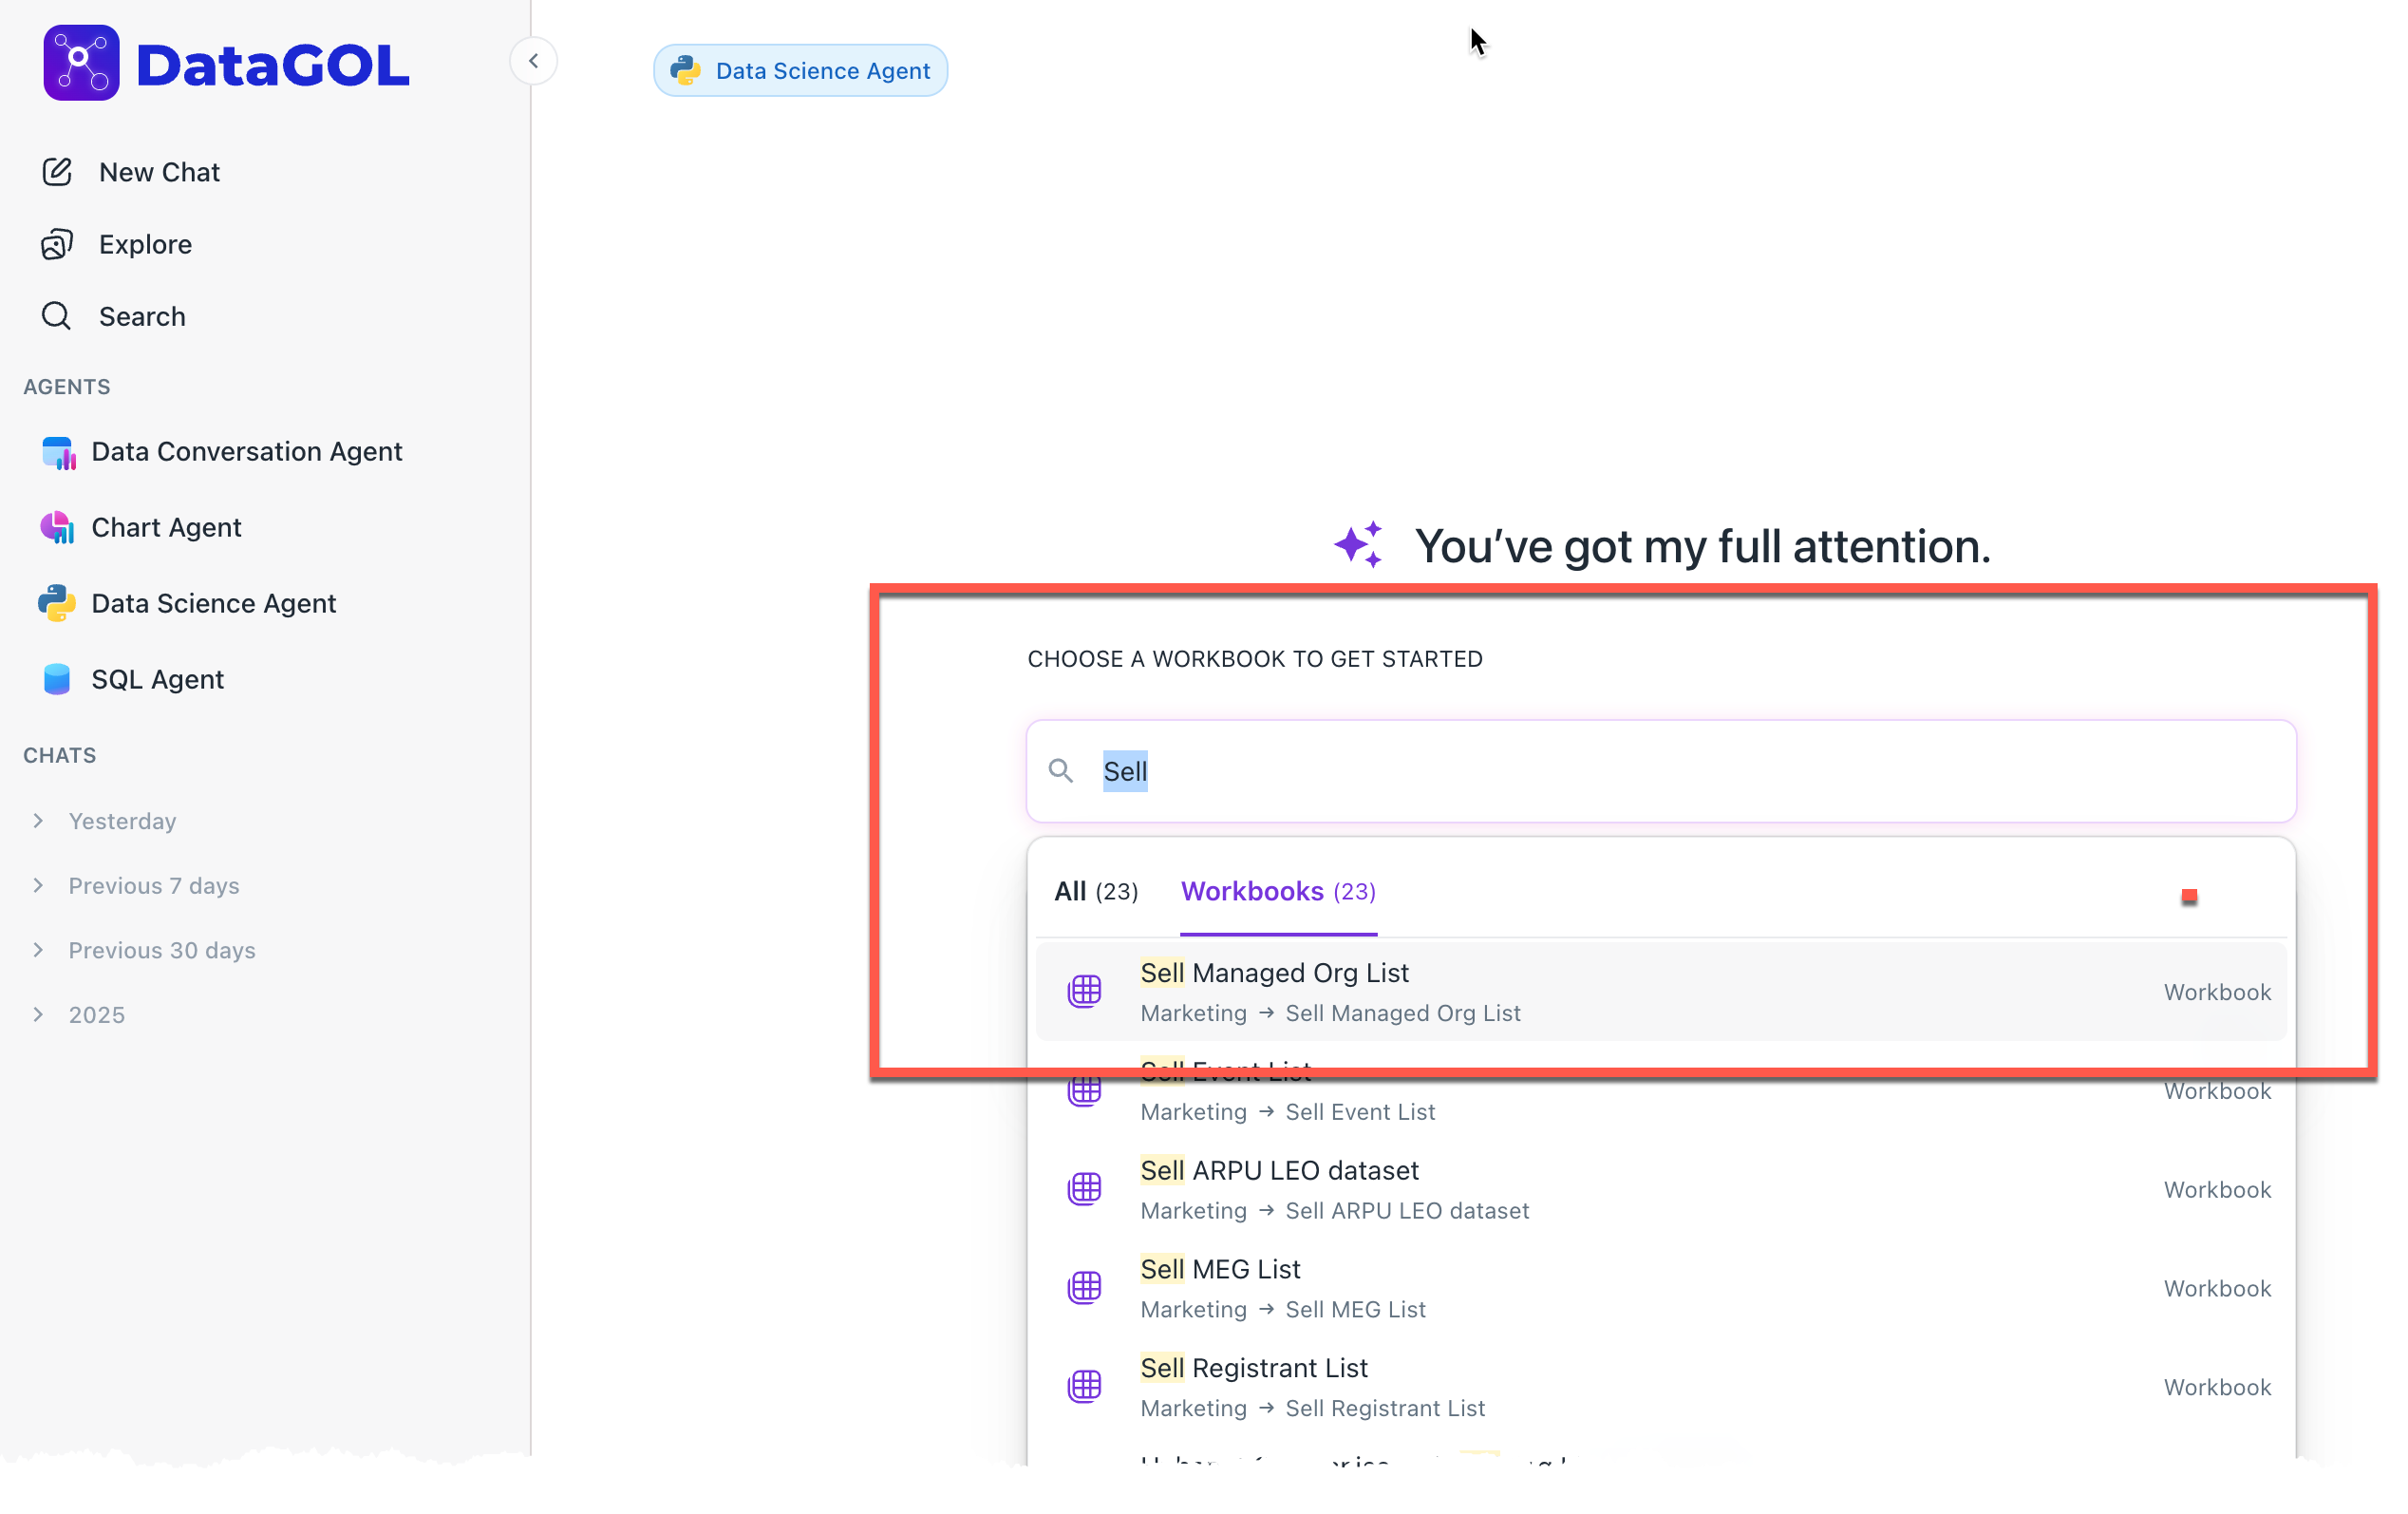
Select data: Choose your sales or transaction dataset.
-
Execute prompt: Enter a query such as:
Use the gross sales and event date columns to perform an RFM analysis. Identify high-value users who haven't been active in the last 3 months.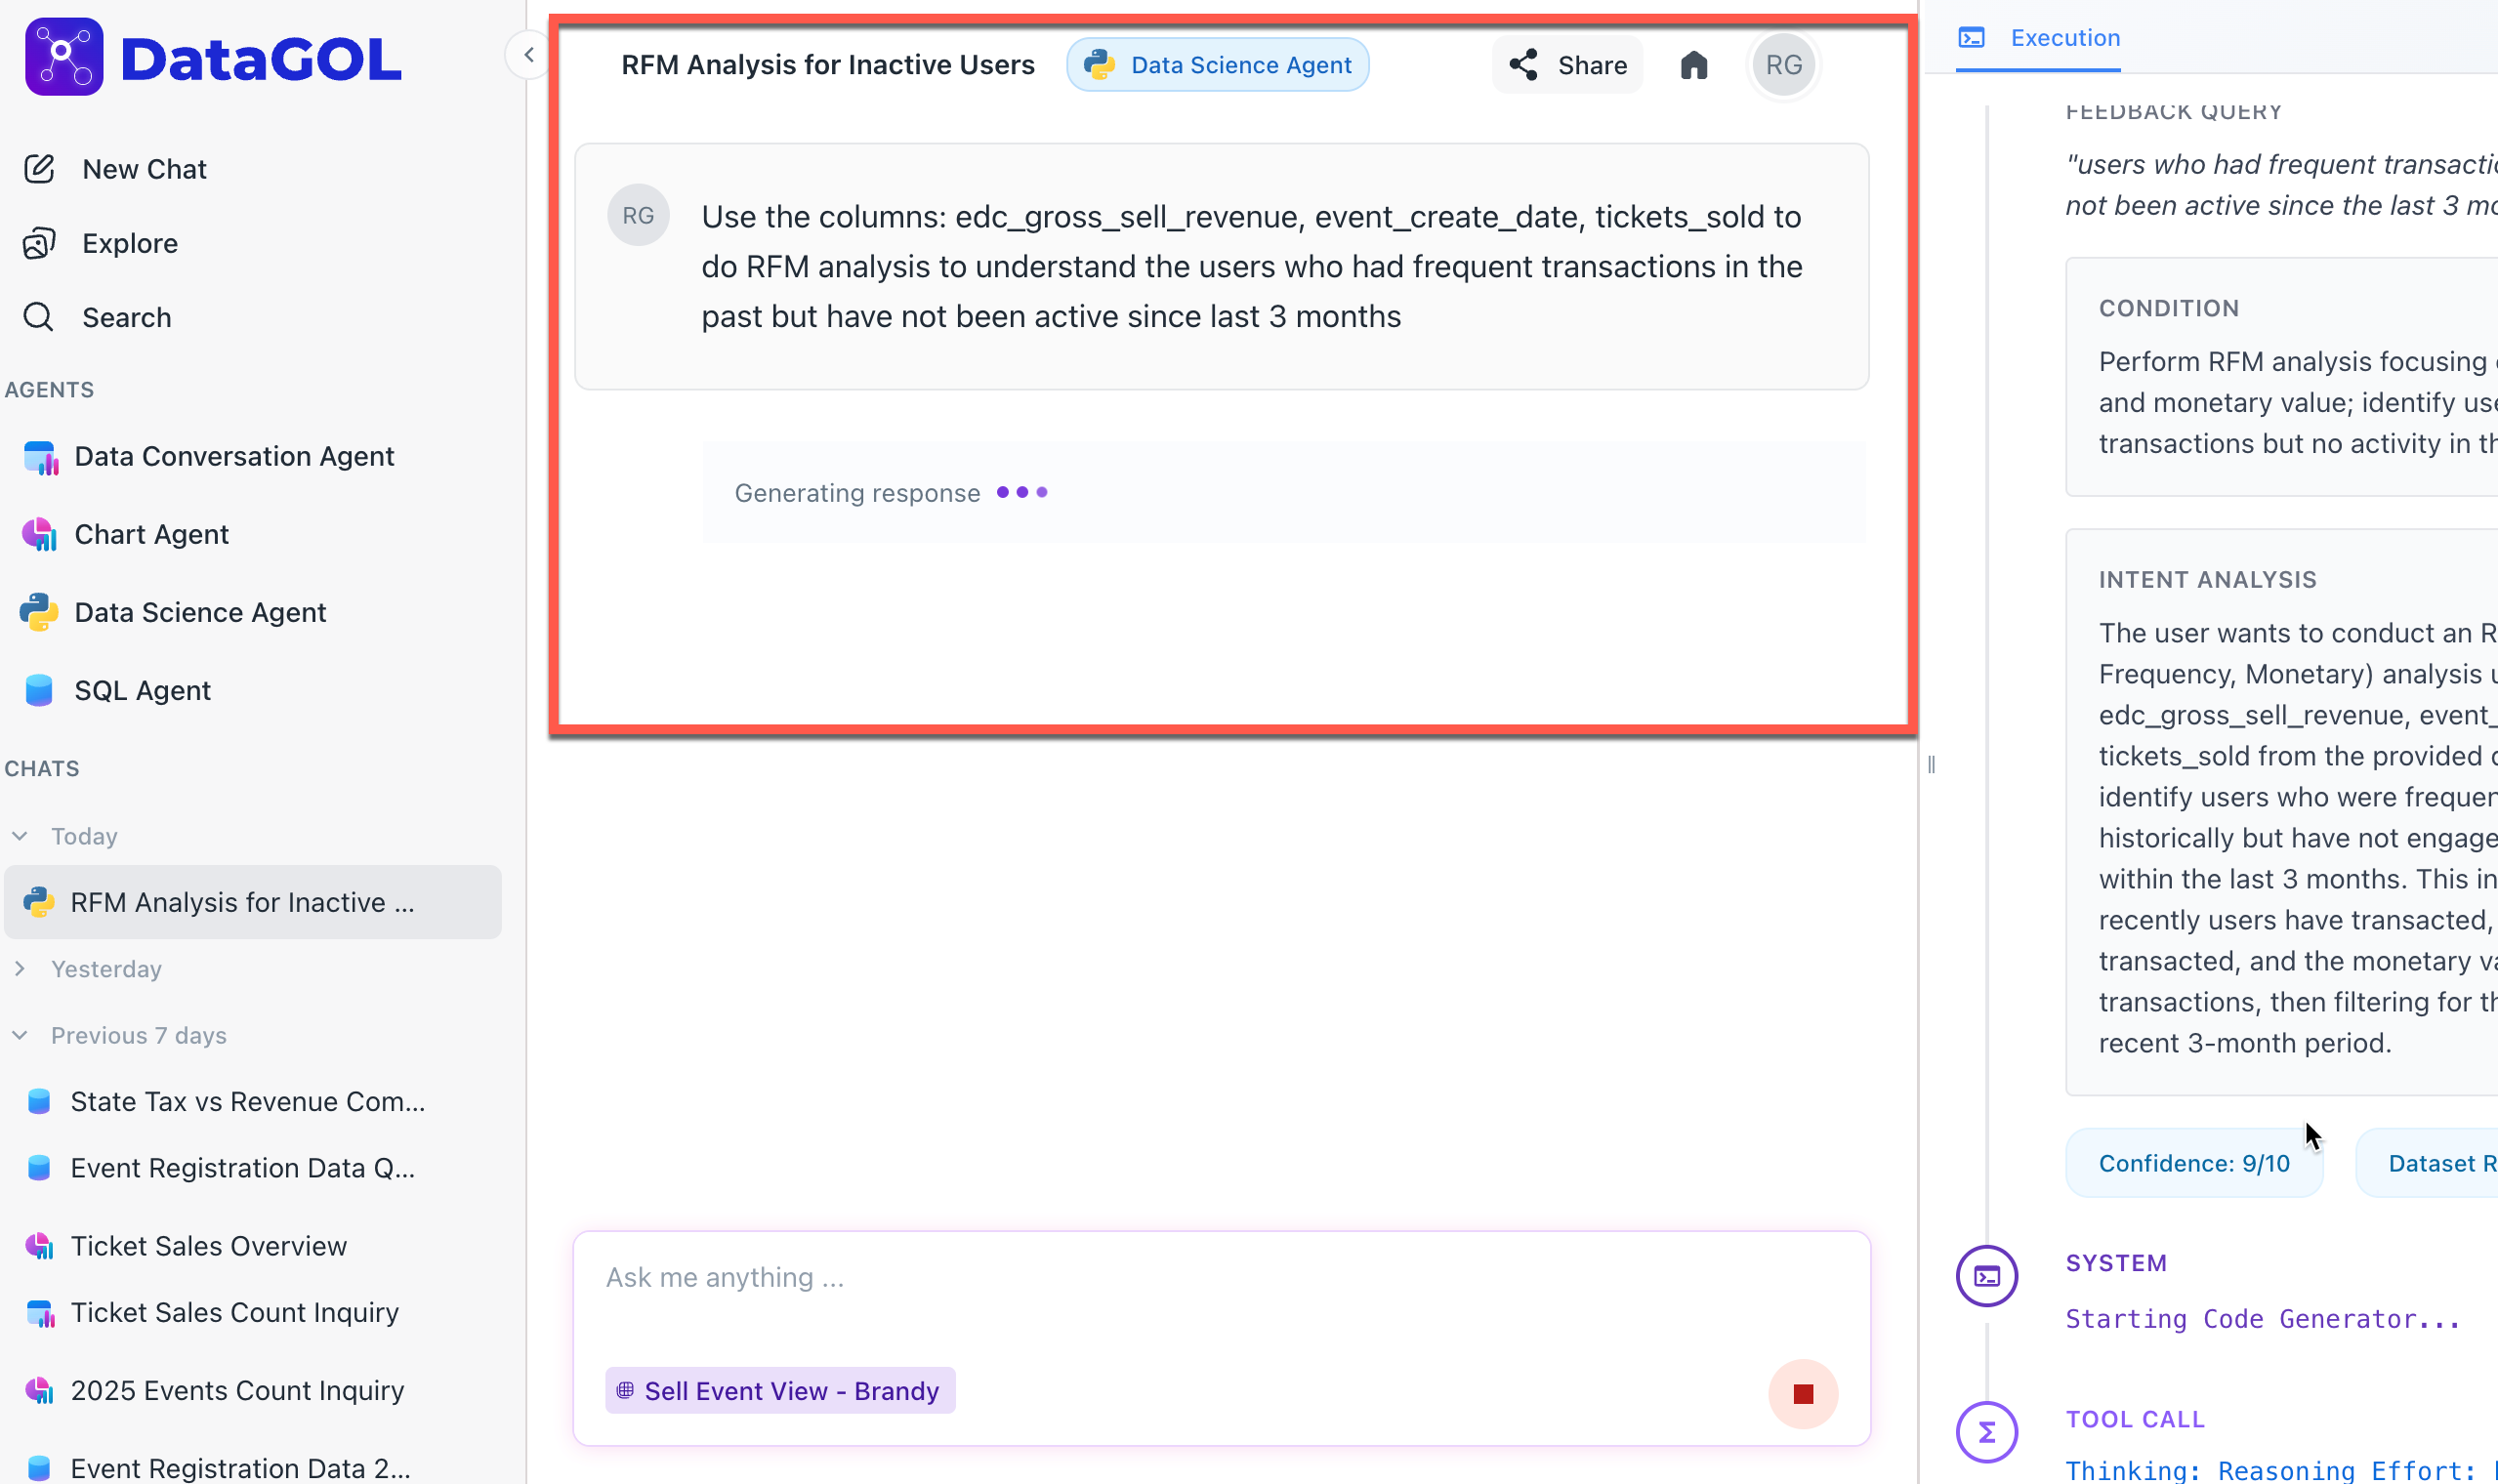
-
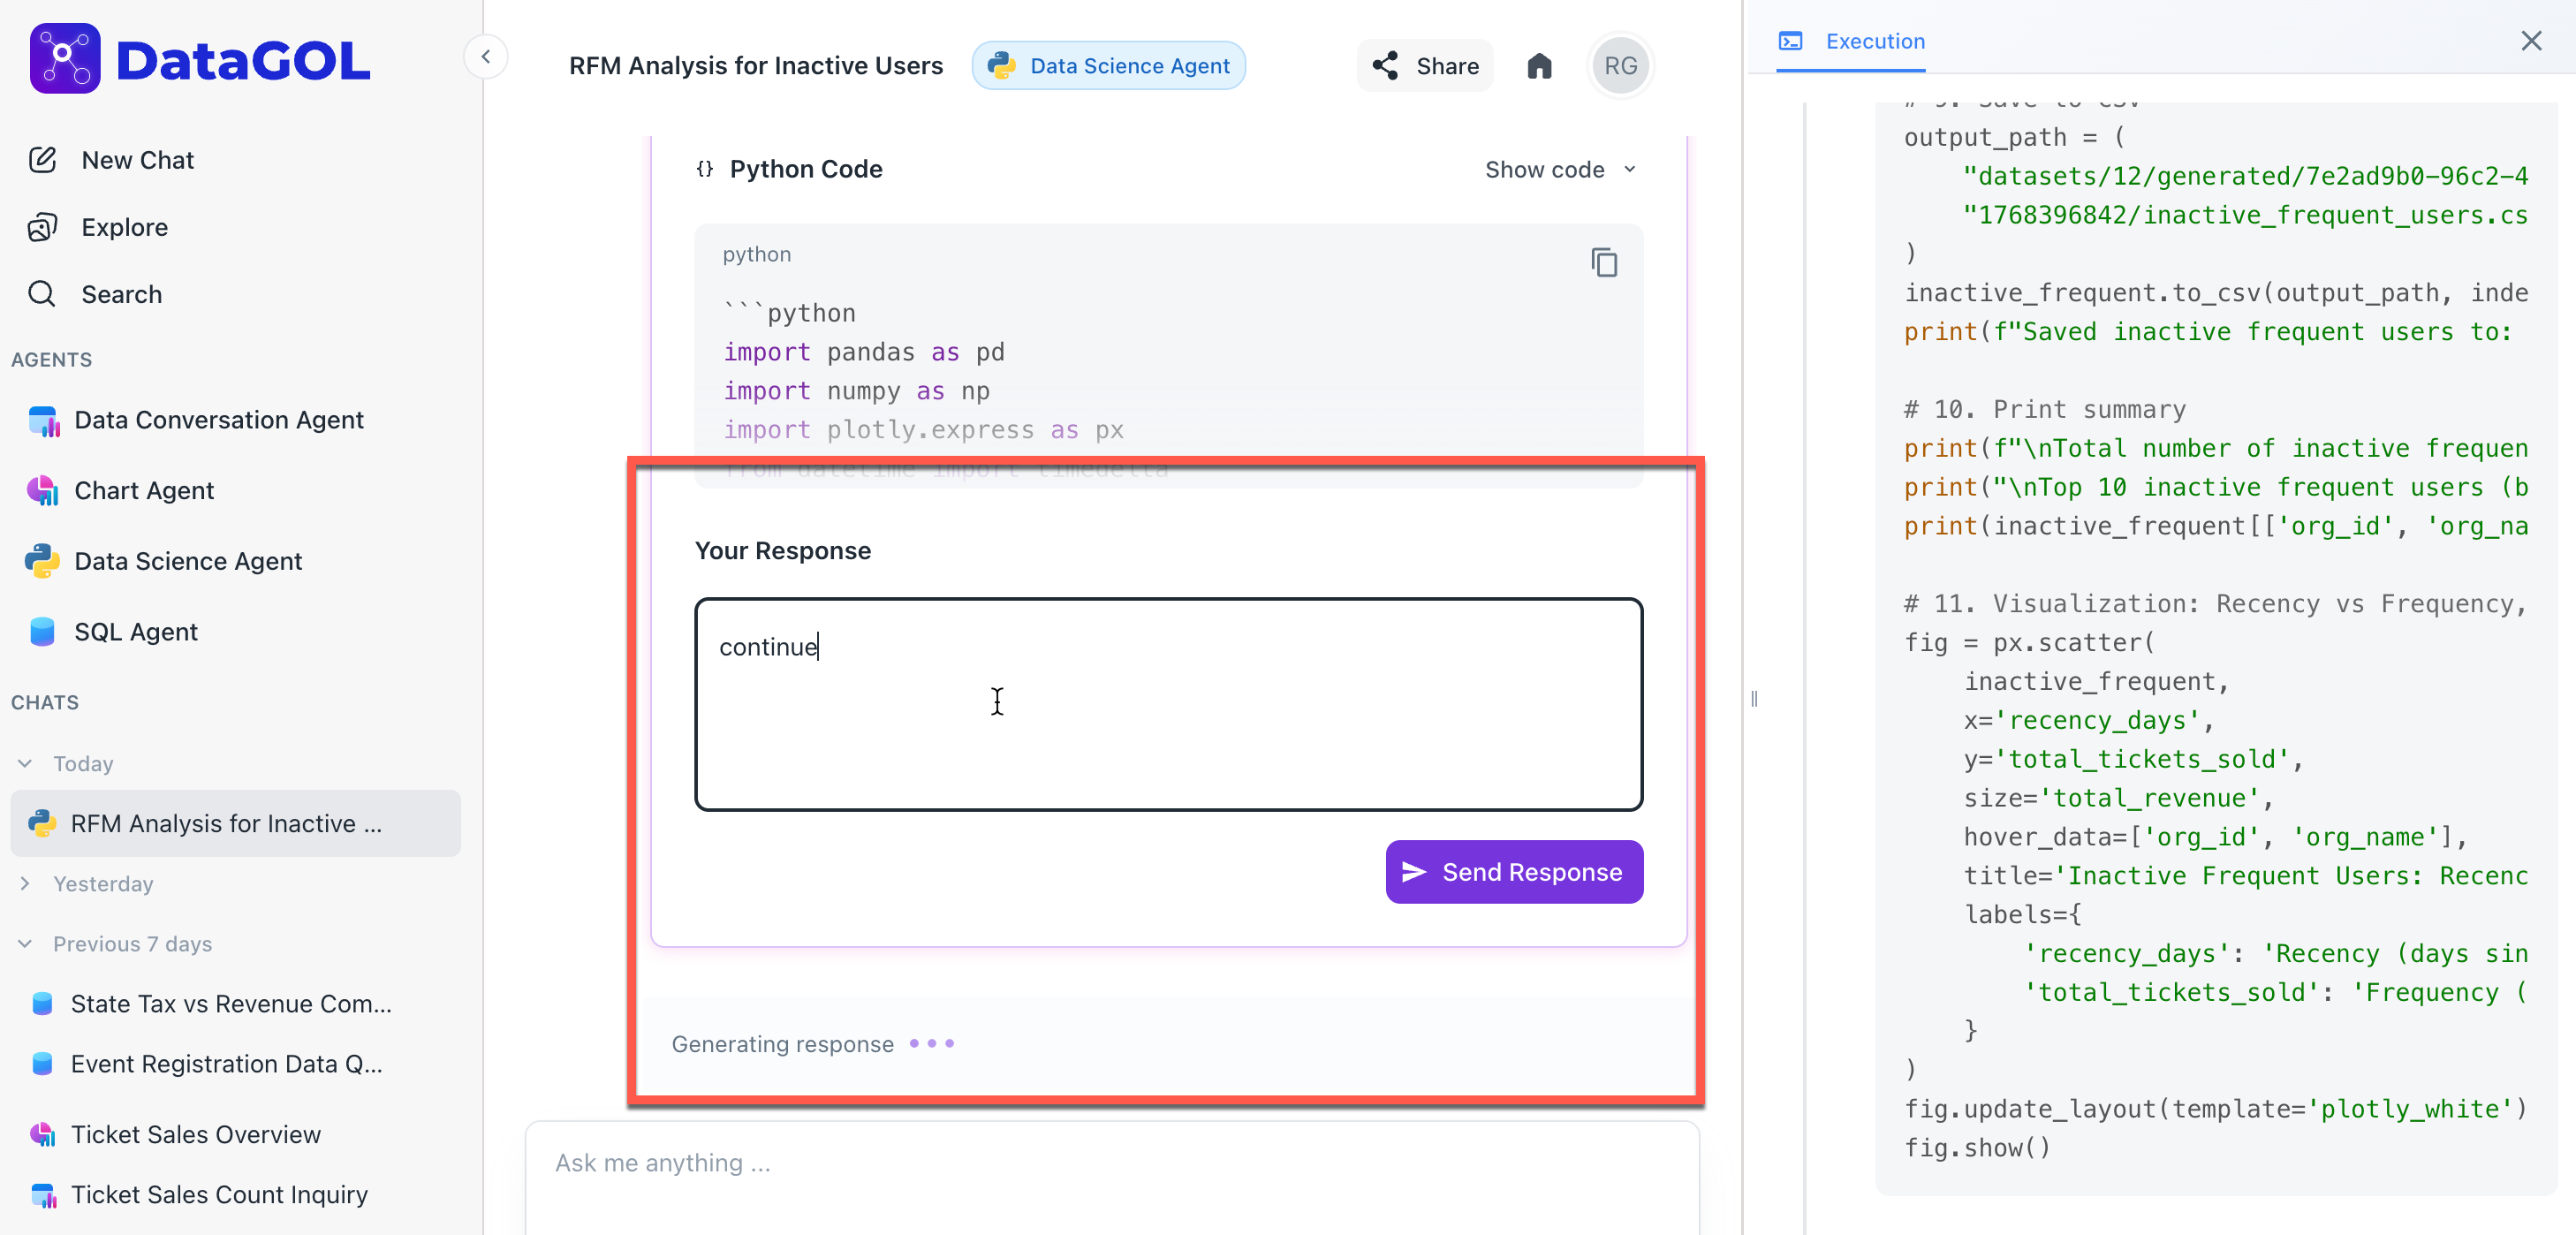
Execution and feedback: An execution panel is displayed on the right which shows the intention of the request and proposes a Python plan. You can submit any necessary changes to the plan as well as for the code through chat. If no changes are required, confirm by entering Continue or I am satisfied.
The agent provides the following output:
-
Calculates the number of days since the last transaction per user.
-
Aggregates total revenue and transaction counts.
-
Filters users based on specific logic (e.g., $Recency > 90$ days).
-
Insights: A summary report (e.g., 34,250 high-value organizations identified) is provided alongwith a downloadable CSV of the results.
-
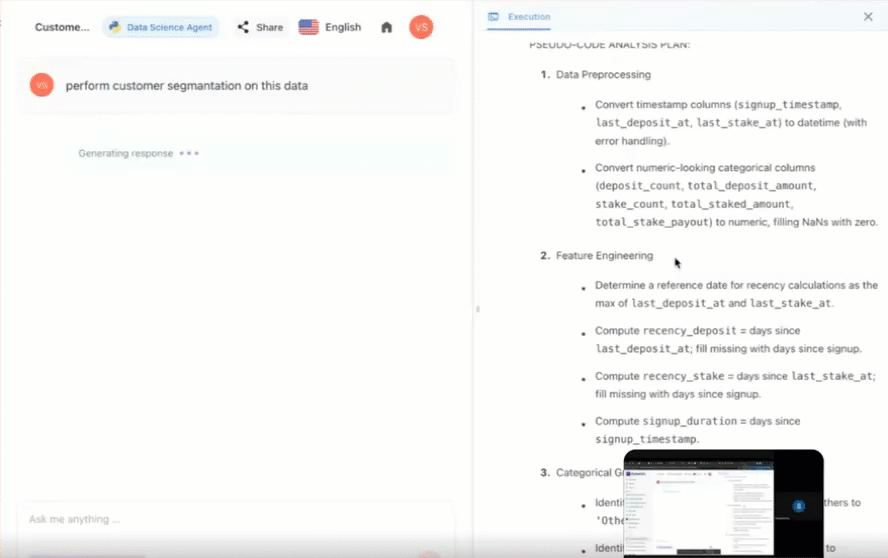
Customer segmentation using Data Science agent
Customer segmentation is the practice of dividing a company’s customer base into distinct groups that share similar characteristics. Instead of treating every customer the same, segmentation tailors customer data for marketing, products, and services to meet the specific needs of each group.
Data Science (DS) Agent automates this entire process by writing the code to find these patterns for you.
Group users into clusters based on shared characteristics like location and media source to optimize marketing spend. General segmentation looks for patterns across diverse categories to find distinct groups.
To generate customer segmentation using Data Science agent, do the following:
-
Identify the goal: Decide what you want to achieve. Are you looking for your big spenders (Value-based) or want to know which regions prefer specific products (Geographic)?
-
Execute the prompt: Select your customer dataset and ask the agent a natural language question.
-
Example query: Enter a query such as:
Perform customer segmentation using available categories to identify distinct customer groups based on their media source and location.
-
-
Review and iterate: The Data Science agent will propose a clustering plan.
-
Approval: Type Continue to see the segments.
-
Refine: Type Add a bubble chart to visualize the size of these segments to make the data easier to present.
-
Output:
-
The agent uses clustering algorithms to group users into segments (e.g., Segment 0, Segment 1, etc.).
-
Insights: Identification of dominant groups (e.g., Segment 0 is the largest group, primarily from Instagram and located in the US).
-
Visualization: Bubble charts or Pie charts showing the distribution of different segments.
-
Cohort analysis with Data Science agent
Cohort analysis is a behavioral analytics method that groups users by a shared characteristic—typically their signup date—and tracks their actions over time. This helps you understand the long-term health of your business by identifying which groups of customers stay active and which drop off.
The Data Science agent groups the users into cohorts (e.g., January Signups) and measures how their activity (e.g., Average Deposit or Retention Rate) changes over subsequent months.
Track customer retention and behavior over specific time periods to understand the customer life cycle.
Follow these numbered steps to conduct a cohort study:
-
Initialize your environment. Navigate to the Agents section and select Data Science Agent. Ensure you have your event-based dataset selected (e.g., event_view or transaction_logs).
-
Formulate your cohort query. Type a request that specifies your grouping criteria and the behavior you want to track
- Example query:
Perform a cohort analysis based on 'signup_month' and 'media_source'. I want to analyze the 'average_deposit_amount' over the first six months for each cohort.
- Example query:
-
Interactive planning (Mandatory)
The agent will identify the correct date columns and propose a logic for calculating retention or spend.-
To approve: Type Continue.
-
To edit: Type changes like Filter out users who haven't made a deposit or Use weekly cohorts instead of monthly.
-
-
Interpret and export results. Once executed, the agent provides:
-
Cohort heatmap: A visual grid showing performance decay or growth over time.
-
Key observations: Automated summaries, such as Users from TikTok in Feb 2024 show 20% higher retention than the average.
-
Data download: Export the full pivot table as a CSV or save the heatmap as a PNG via the Camera icon.
-
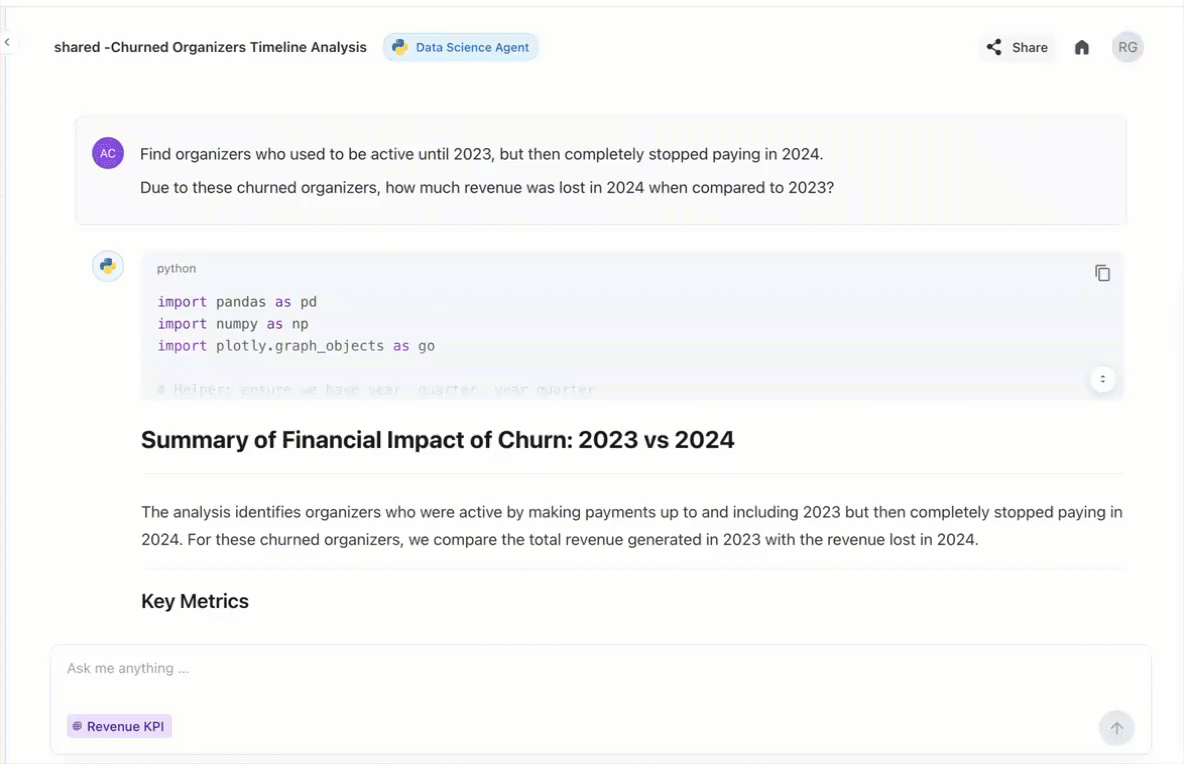
Customer churn analysis with Data Science agent
Churn analysis is the process of identifying which customers are likely to stop using your service or product. By analyzing historical behavior, the Data Science (DS) Agent helps you pinpoint at-risk users and understand the factors driving them away, allowing you to take action before they leave.
The DS agent simplifies churn modeling by automating the complex math required to track user activity over time. The agent defines churn based on a period of inactivity (e.g., no login or payment for 30 days) and correlates this with other variables like support tickets or declining usage.
Identify customers who are likely to cancel and determine why they are leaving.
To perform customer churn analysis using Data Science agent, do the following:
-
Initialize your environment. Navigate to the Agents section and select Data Science Agent.
-
Select data: Choose your dataset in the workbook. Ensure you have your user activity or subscription workbook selected (e.g., user_logs or billing_data).
-
Formulate your churn query. Type a request that defines your churn criteria. Be specific about the timeframes you want the agent to analyze
- Example query:
Analyze the 'last_active_date' and 'subscription_status' columns to identify users who haven't logged in for over 30 days. Correlate this churn with their 'plan_type' and 'region'.
- Example query:
-
Interactive planning (Mandatory). The agent will propose a plan to calculate your churn rate and identify the feature importance—the factors most linked to churning.
-
To approve: Type Continue.
-
To edit: Type changes like Only analyze users who joined in the last 6 months or Include a bar chart showing churn by country.
-
-
Interpret and export results. Once executed, the agent provides a multi-layered output:
-
Churn rate: A high-level percentage of your total base that has churned.
-
Risk segments: A list of users categorized by their probability to churn.
-
Visual insights: Trend lines showing if churn is increasing or decreasing over time.
-
The Data Science offers the following enhanced data analysis and visualization capabilities:
-
Advanced analysis: It can perform complex analysis, visualization, and transformation, and provide insights into your data.
-
Multiple outputs: It can provide multiple related outputs (e.g., several tables or charts) for a single user question, unlike the previous version, which was limited to one output.
-
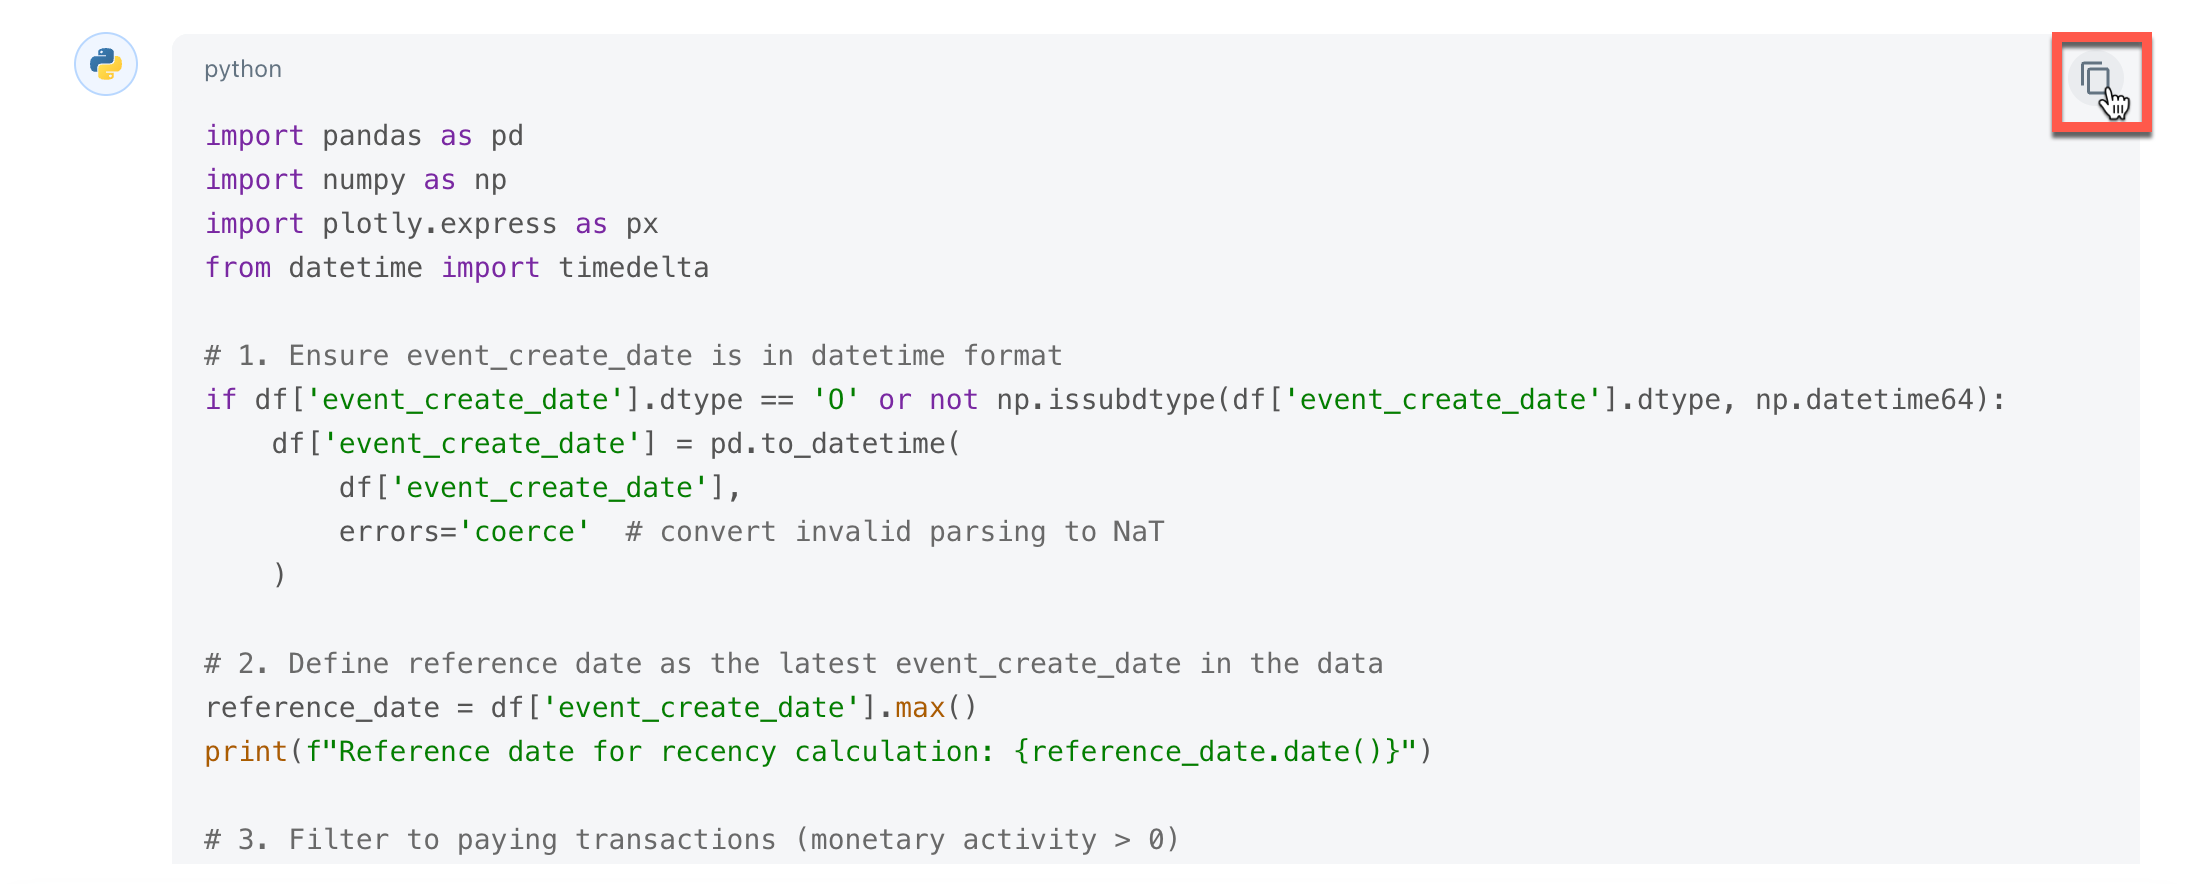
Code transparency: It provides the working Python code it generated and executed to produce the results, allowing you to review the logic.
-
Interactive visualizations: The generated charts and tables are now more interactive. You can hover over elements to see labels and data points, and you can zoom into the charts for closer inspection.
-
Streaming responses: The agent utilizes a streaming format, responding in real-time as the analysis is completed.
Core capabilities of the Data Science agent
Automated code generation and execution
The agent eliminates the need for manual programming. When a user asks a question, the agent automatically identifies the necessary Python libraries, writes the scripts for data cleaning and aggregation, and executes them to produce immediate results.
Interactive planning and feedback loops
One of the agent's most unique features is its planning phase. Before running any analysis, it proposes a logical path and shows the intended code to the user. This allows for a collaborative process where the user can request modifications—such as changing a chart type from a bar graph to a pie chart—before the final output is generated.
Advanced behavioral modeling
The agent is specifically tuned for behavioral analysis. It can handle complex time-based queries, such as identifying churned users who were active in a specific quarter but have since stopped making payments. It specializes in grouping users by common characteristics (segmentation) and tracking those groups over time (cohort analysis).
Visual storytelling and data export
Beyond text-based answers, the agent generates a variety of visual aids, including bubble charts, heatmaps, and distribution plots. Every insight generated is actionable; users can download the processed data as CSV files, save the visualizations as images, or copy the underlying Python code for use in other technical environments.
Insightful interpretation of results
The agent goes beyond the what to explain the why. After generating a report, it provides a summary of key observations—such as identifying which media sources are driving the highest revenue or noting specific trends in user behavior—making it easier for stakeholders to make data-driven decisions
What’s New
Multi-Dataset Support in a Single Chat
You can now load and analyze multiple datasets within the same conversation. In addition to the primary workbook, users can attach and work with additional workbooks simultaneously for richer cross-table analysis and comparisons.
Improvements
- Compare data across multiple workbooks in one workflow
- Perform cross-table analysis without switching chats
- Combine insights from related datasets more efficiently
- Streamline exploratory analysis and reporting across files
Was this helpful?